ITSM metrics are the numbers that show how well an IT team is delivering its services, how fast it responds, the reliability of services, and how the requesters feel about it. That is the short answer to what ITSM metrics are. However, most IT teams track too many of them and act on only a few. Picking the right ones is the harder part of the job.
This guide covers the difference between a KPI and a metric, 20 ITSM KPIs grouped by practice with a formula for each, a starter set of five for a small team, the dashboards for each audience, and the metric traps to avoid.
Key Takeaways
- A KPI is used to track progress against a goal. The metrics underneath it are the explanation, they tell why a KPI moved up or came down in a period.
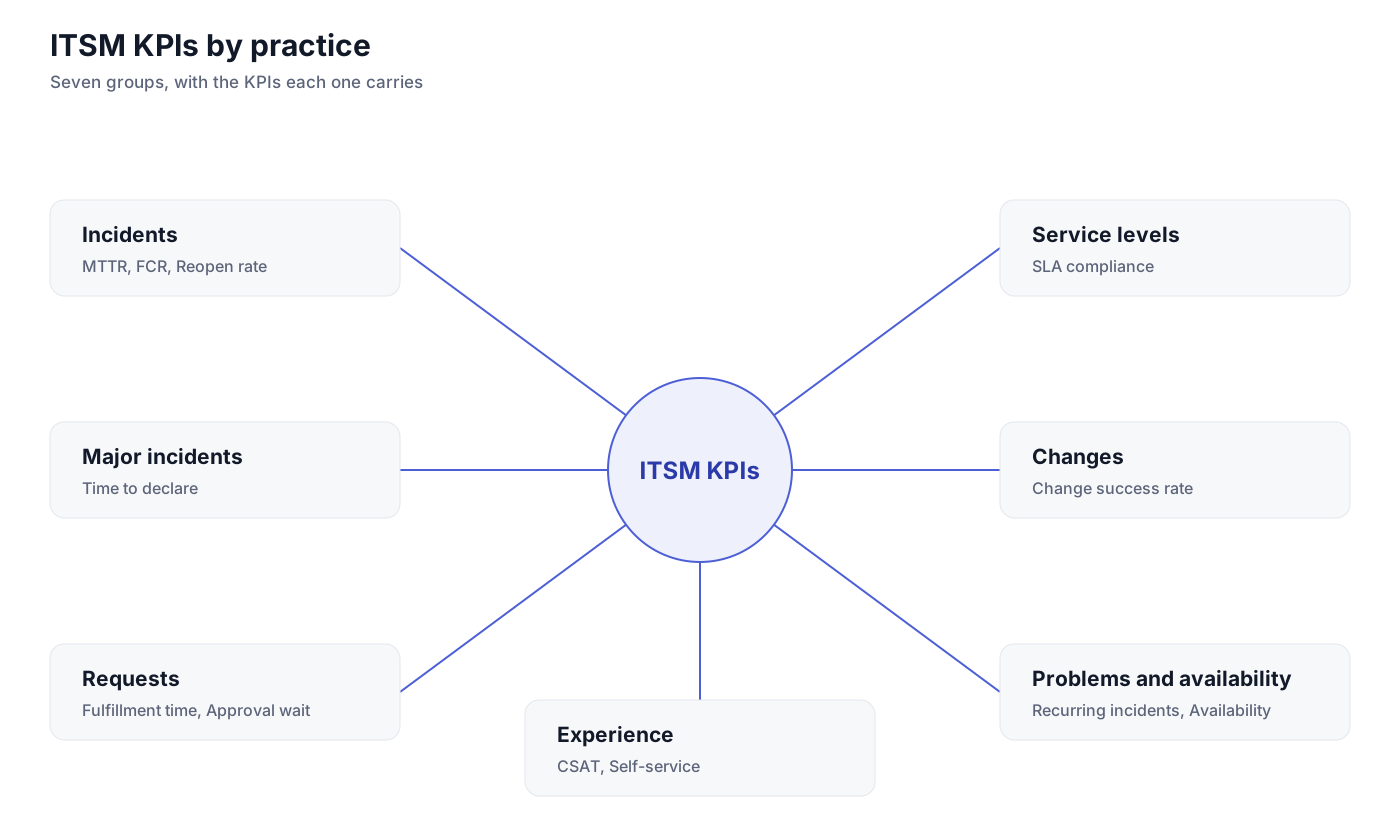
- Seven practices hold the core KPIs, incidents, service requests, changes, problems, service levels, availability, and the satisfaction of the requester.
- Ticket timestamps and status changes give most of these numbers.
- On a team of 3 to 8 people, five KPIs are enough to begin with, and a sixth should be added only when there is a decision that needs it.
- Medians and trends should be reported instead of a single average, because the average hides the handful of tickets that ran for days, and it makes the report look calmer than the service was. Every KPI also needs a goal attached to it.
ITSM KPIs vs ITSM Metrics
A KPI is the number that is reported against a goal, and a metric is the number that gets pulled when the KPI has to be explained. SLA compliance reported against an agreed target is a KPI. The same ticket data broken into MTTR by priority is a metric, and it is used to explain why the compliance figure changed.
IT metrics is the wider term that covers anything measured inside the IT function, like server uptime, the license count, and what a tool costs per year. The measures that come out of the practice of IT service management are narrower. IT service management metrics is the term for those, the numbers on incidents, requests, changes, and the rest.
Review cadence is the other separation. A KPI is reviewed on a cycle, monthly or quarterly, against the goal that was set for it. Metrics get looked at when a KPI needs explaining.
20 ITSM KPIs to Track, by Practice
The KPIs below are grouped by the practice they belong to, and the calculation of each one is given along with it.
Service Desk and Incident Management KPIs
Incident management KPIs are the first set that most service desks will be reporting on. Six metrics are the most common ones you should start with, such as:
- Mean time to acknowledge is used to measure the time a ticket is waiting before an agent gives the first reply on it. For the calculation, you take first response time minus creation time on each incident, and the total of that is divided by the number of incidents in the period. When this number is going up, it means the queue is not getting picked up in time.
- Mean time to resolve, which is the one everybody asks for, measures from the logging of an incident till the point it is resolved. The calculation is resolved time minus created time, totalled across the incidents that were resolved, and then divided by how many of them there were. It should be reported by priority. You should also be showing the median along with it, because one incident that stayed open for a week will lift the average of the whole month.
- First contact resolution rate is the percentage of incidents that are getting closed in the first interaction itself, with no follow-up and no handover to anybody else. Incidents resolved at first contact are divided by all incidents, then multiplied by 100. It is helpful for understanding the capability of your first line.
- Reopen rate. Tickets that were closed and then opened again, divided by the resolved tickets, multiplied by 100. The reopen rate should always be read together with first contact resolution, because the tickets that get closed too early will push one number up and the other one also.
- Escalation rate can be calculated on the incidents that your first line could not finish and had to pass on to a second line or to some other team. Escalated incidents divided by all incidents, multiplied by 100.
- Incident volume is just a count for the period, and it should be split by category and by priority. No target is set on the volume. You are only looking at the trend in it, month on month.
All six of these are coming out of the stages in incident management, the logging, the first reply, the resolution, and the closure. Targets on them should be set from your own last 30 days to begin with, and the help desk metrics benchmarks published for the industry can be used for comparison later on.
Major Incident KPIs
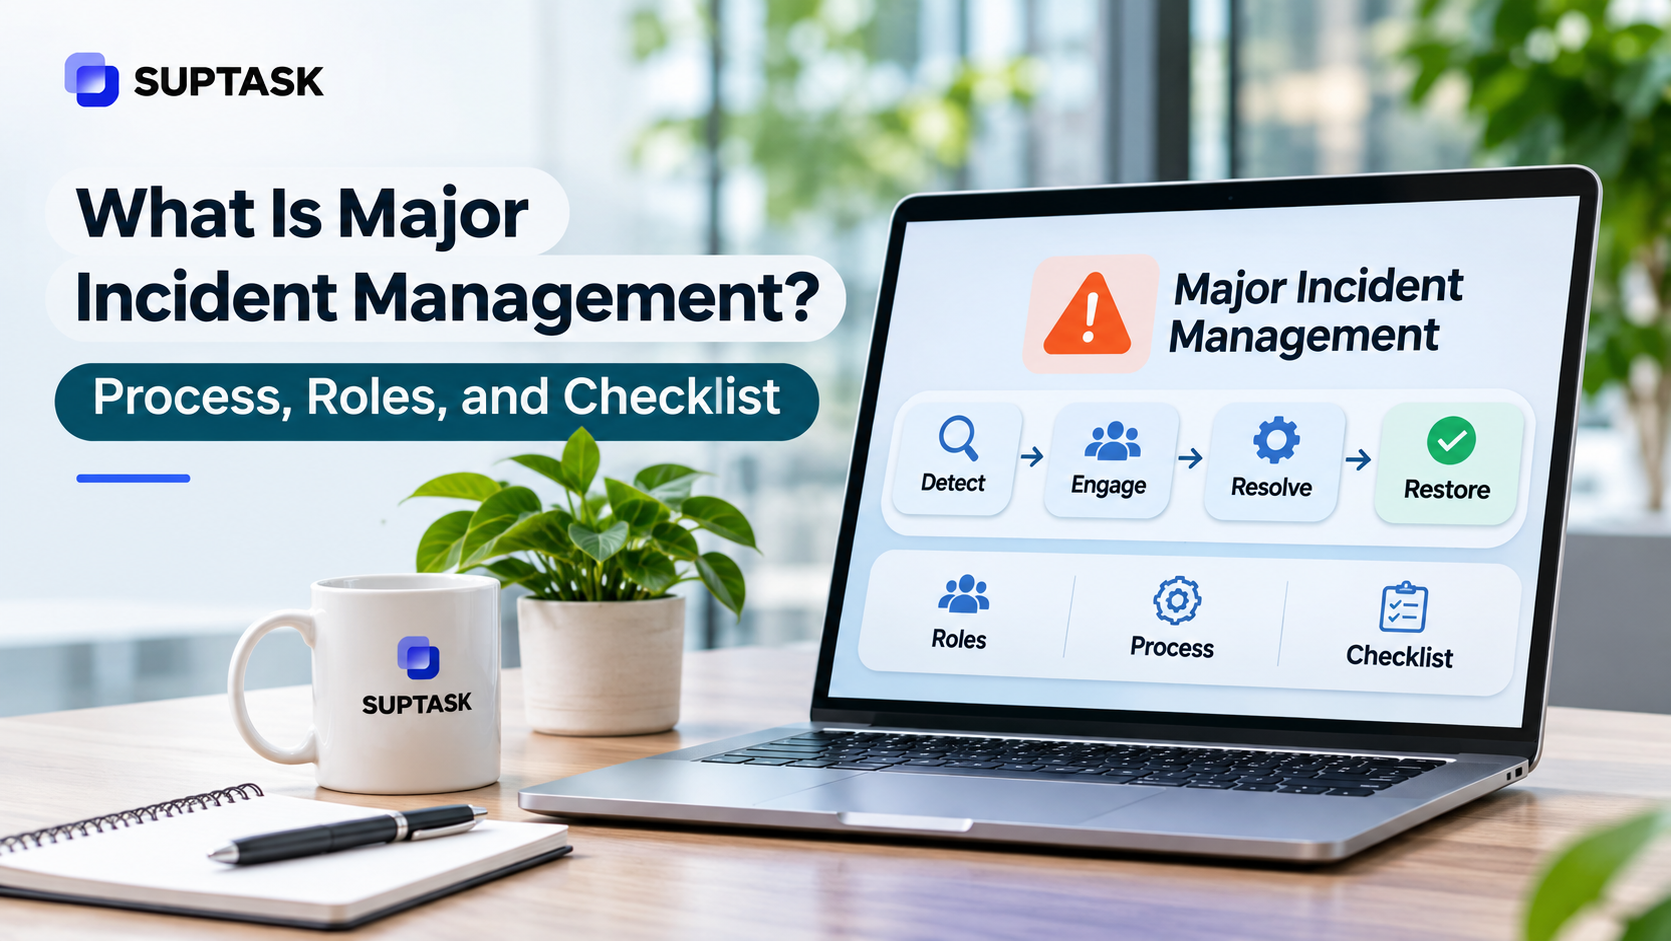
Major incidents are counted separately from the normal ones, also, the handling of them is different. Two KPIs can be used for major incidents.
The first one is a simple count of how many major incidents have happened in the month. The second one is the time to declare, which is the gap between the first alert coming in and somebody actually calling it a major incident, so declared time minus first alert time. A long time to declare will delay everything that comes after it, which includes the bridge call, communication to the users, and the fix. The declaration step in major incident management is what you are measuring with this one.
Service Request KPIs
Requests are planned work, so the measures on them work differently from the incident side. Service request management has a fulfillment step at the end of it, and the clock on these three keeps running till that step is done.
Request fulfillment time is the one your requesters will be noticing the most. You take the fulfilled time minus the submitted time on every request, and the total gets divided by the number of requests that were fulfilled. Where the request types are not similar to each other at all, it should be reported per type, otherwise, a laptop request and a password reset are getting averaged into one figure.
Approval wait time pulls out the portion of that which went only into waiting for a person. Approved time minus the approval requested time, totalled, then divided by the number of approvals. It is helpful when the fulfillment time looks bad, and the team wants to show where the delay is actually happening.
Then there is the request backlog, a count of the open requests at the end of the period. The age of the backlog should be given along with the count, because an old backlog and a new backlog of the same size are two different problems.
Service Level KPIs
Service level KPIs have two numbers coming from the SLA itself.
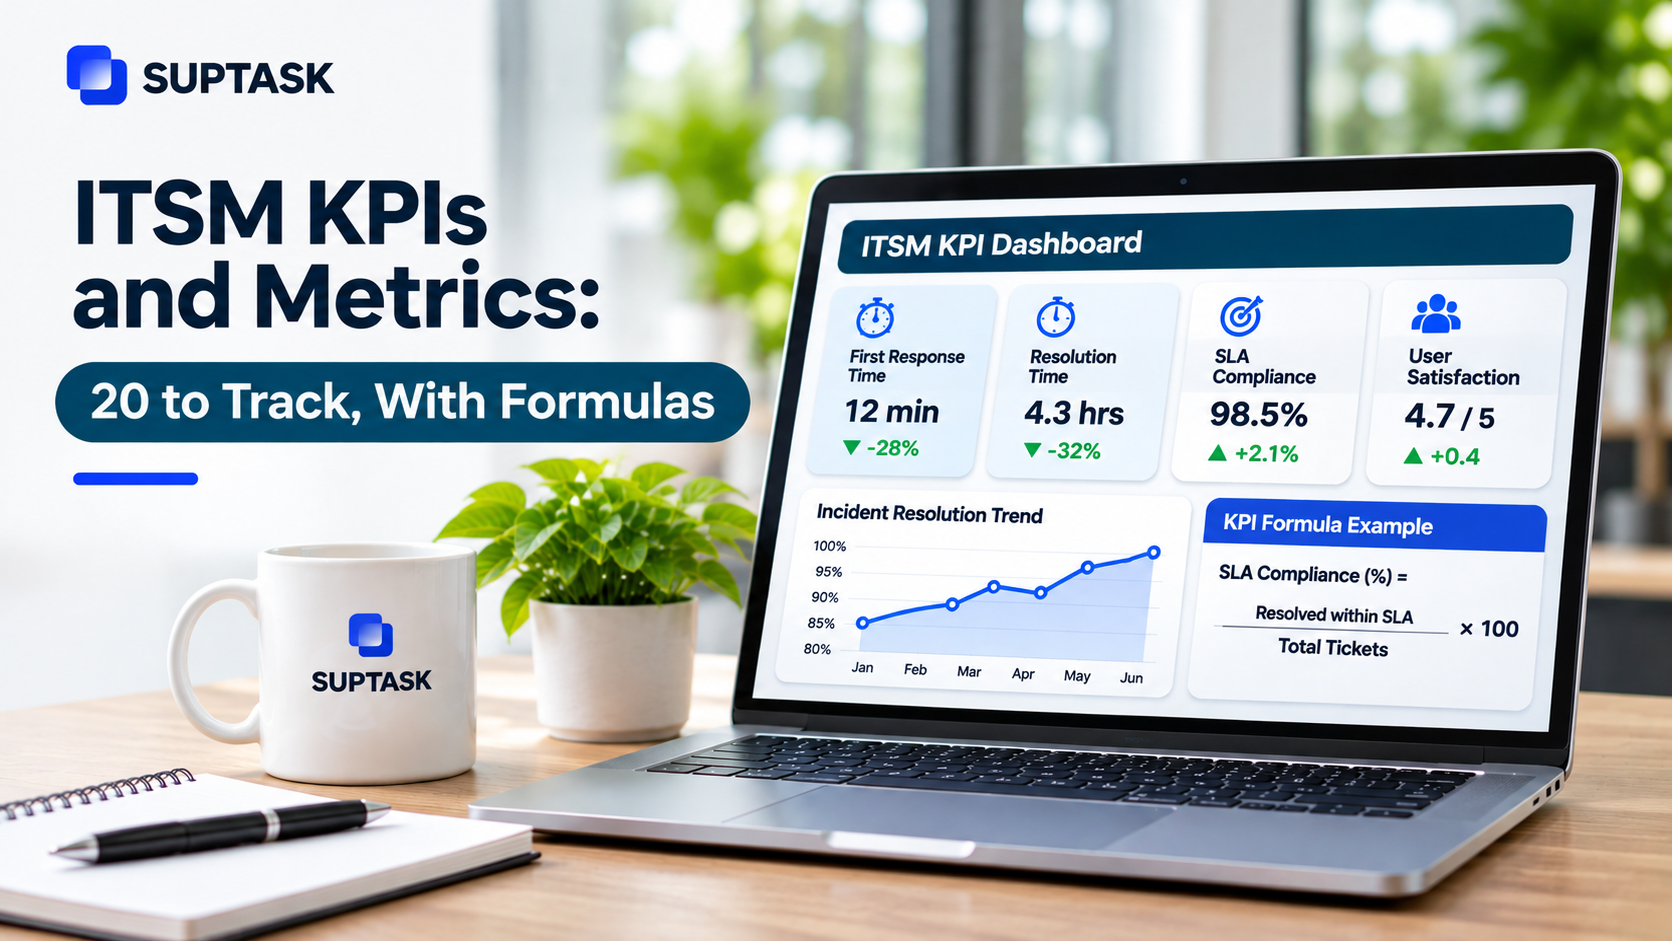
SLA compliance is the percentage of tickets that met their target. The tickets that met the SLA are divided by the tickets that had an SLA on them, multiplied by 100. You should be running it separately for the response target and for the resolution target, because a team can be fast on the first reply and still slow on the fix.
SLA breaches are the second one, and it is only a count, broken down by priority and by team. The breakdown is what shows you which team is needing the help.
The target each number is measured against is written into the agreement, and the SLO vs SLA vs SLI difference decides which of them is a promise made to the requester and which one is kept internally.
Change KPIs
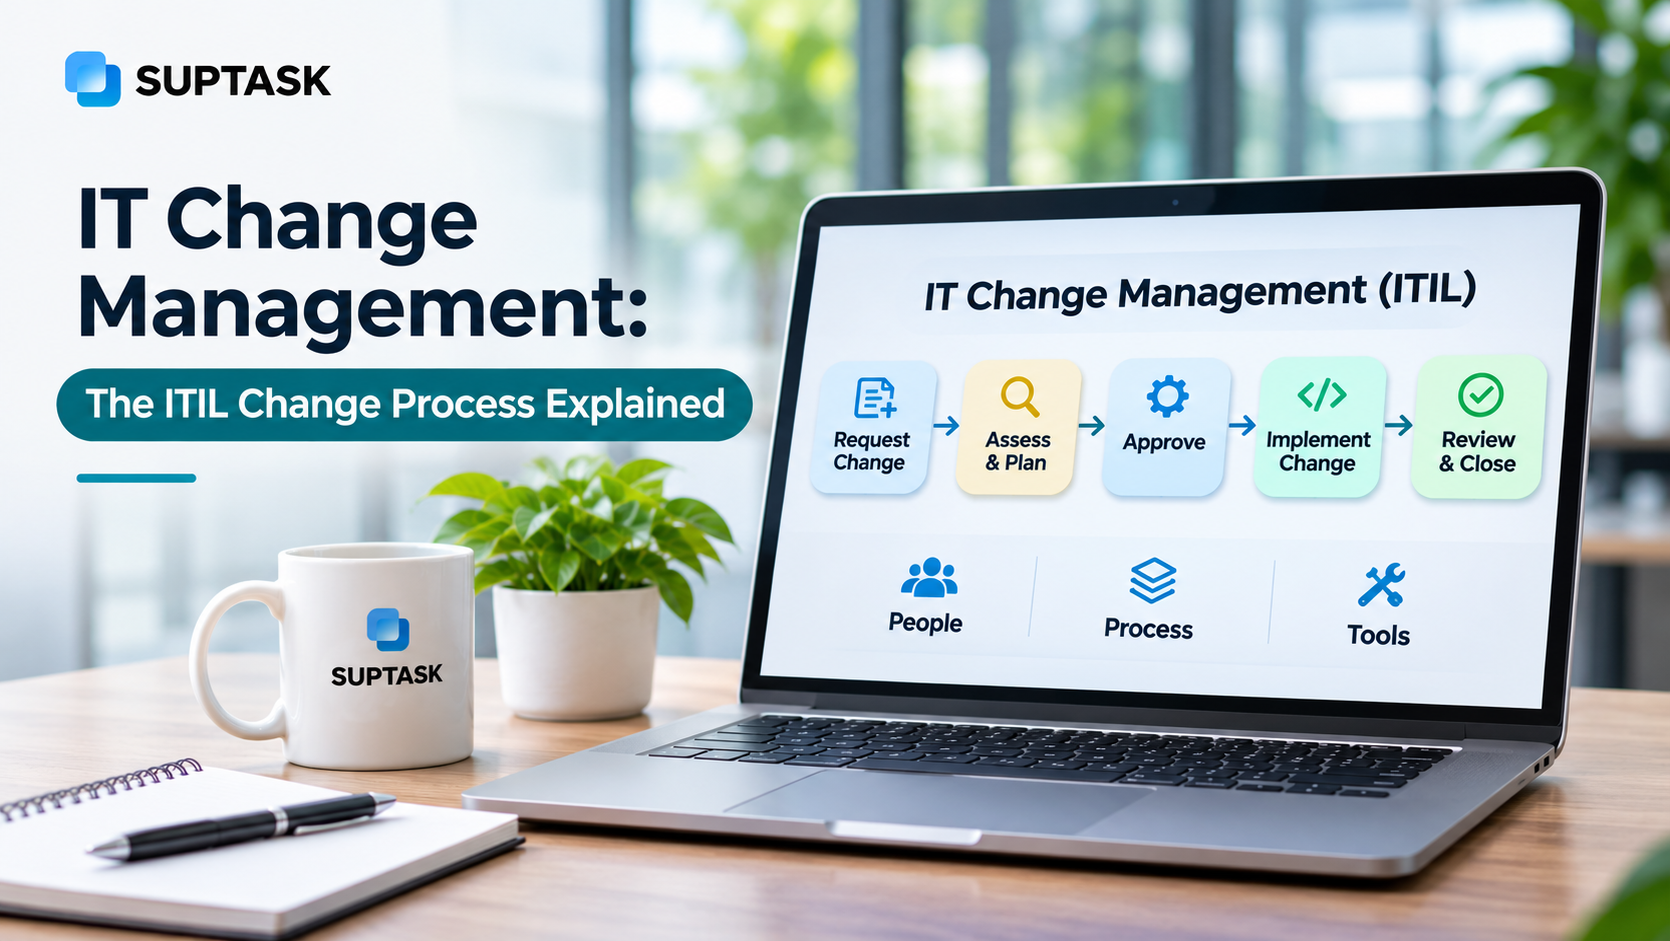
Every change that goes through IT change management leaves a record behind it, and three numbers can be taken out of that record.
- Change success rate is the percentage of your changes that got completed without causing an incident and without a rollback behind them. The changes completed without an incident or a rollback are divided by all the changes, multiplied by 100.
- The changes that did cause an incident are counted on their own also, as a count or as a share of all the changes. Kept next to the success rate, it will tell you whether the review step is doing anything or it is only a formality.
- Emergency change share. Emergency changes divided by all changes, multiplied by 100. A high share is telling you that changes are going around the normal review.
Problem and Availability KPIs
Problem management and availability are reported together in most cases, and these two are the IT operations KPIs on this list.
Recurring incident rate is used to show how much of the queue is coming back from a problem that is already known. The incidents that are linked to a known problem are divided by all the incidents, multiplied by 100. When this rate stays high, the root causes are not getting closed, and your service desk keeps absorbing the same tickets again and again.
Service availability is calculated as the agreed service time minus the downtime, divided by the agreed service time, multiplied by 100. The agreed service time is the window for which the service was promised. A service that is promised 24/7 will be measured over the whole period, and one that is promised on business hours only gets measured on those hours.
Experience and Self-Service KPIs
Requester satisfaction is collected from a reply that the requester gives after the ticket is closed. The satisfied responses are divided by all the responses received, multiplied by 100. Response rates on these surveys are low, so you should be reading the figure as a trend over several months. CSAT reporting is included from Professional upward on Suptask’s plans, and you are getting the number out of the help desk itself without any separate survey tool. On the customer side, the same measure is used, though the customer service KPIs go wider than what a service desk is tracking.
Self-service resolution rate is the requests that got closed without an agent touching them at all, divided by all the requests, multiplied by 100. Knowledge base articles and the AI answers are both counted in it. An AI help desk that answers from your knowledge documents is the thing that moves this number.
Start With These 5 ITSM KPIs
Small teams with 3 to 8 people might be overwhelmed by the twenty KPIs every month. The best practice is to begin with the five most important metrics, and the following ones are the most common ones:
- SLA compliance should be the first one, because it tells you directly whether the promise made to the requester was kept.
- Mean time to resolve, taken as the median and split by priority, will show you where the time is going. The average on its own is not that useful when a few tickets are running very long.
- How much your first line is able to finish without passing it on is what first contact resolution shows you.
- Reopen rate is kept next to it as a check, because first contact resolution can be pushed up by closing the tickets too early.
- The fifth one is requester satisfaction, which gives you the view from the person who raised the ticket. The other four are all measured on the ticket data, this one is not.
As the team grows, two more KPIs can be added. Changing the success rate makes sense once your changes are getting logged somewhere, and the recurring incident rate will only work after the problems are being tracked separately from the incidents.
Where the Data Comes From
Most of the KPIs that we have discussed in this guide don’t need to collect new data. The help desk is already putting a timestamp on the ticket at every point where something happens to it. From when it was created, when the first reply went out, when the status was changed, when it got resolved, to when somebody opened it again. Approvals are recorded the same way, the time an approval was asked for and the time it came back. Requester satisfaction is the one exception, it comes from the replies that people give to the survey.
Help desk reporting is the step where these fields are turned into something a person can actually read, and in a lot of teams it is still a spreadsheet which somebody updates by hand every month. An ITSM ticketing system with built-in analytics like Suptask is giving you the ticket volume, the response and resolution times, the SLA performance, all of it from the tickets themselves, so no export step is needed in between. How the pulling and the formatting are handled either way is covered in help desk reporting.
Two things will change these numbers, and both should be settled before you report anything. The first one is business hours. If your SLAs are written on business hours, then the calculation has to run on business hours also, otherwise, the hours when nobody was working are getting counted into the resolution time.
The second one is the waiting time of the requester. A lot of SLA policies are stopping the clock while the ticket is sitting with the requester for some information, and if your policy says that, then the same pause should be taken out of MTTR too. Both of these should be written down once, so that two people are not calculating the same KPI in two different ways.
ITIL KPIs and Critical Success Factors
ITIL 4 has no fixed list of KPIs to track. The practice guides in ITIL 4 are doing it the other way around, each practice gets its success factors written down first, and key metrics are mapped against those.
The service desk guide states it directly, universal KPIs cannot be recommended for the practice, because the target value for any metric depends on the context of the organization.
One thing about the wording. ITIL 4 calls these practice success factors. The older ITIL term for the same idea is a critical success factor, and plenty of teams are still writing it that way in their reports.
An ITIL KPI on its own is not telling you very much, it needs the outcome which it is supposed to be showing. The pairing works like this.
ITIL metrics are read in the same way across every practice. When a number on your report is not connected to a success factor, nobody can say whether it is a good number or a bad one, and it can come off the report.
ITSM Reporting: Dashboards for Each Audience
ITSM reporting gets ignored when the same screen is sent to everybody. An agent and a director do not need the same numbers at all, and an ITSM dashboard carrying twenty widgets gets read by neither of them. Four or five numbers per audience is enough to get started.
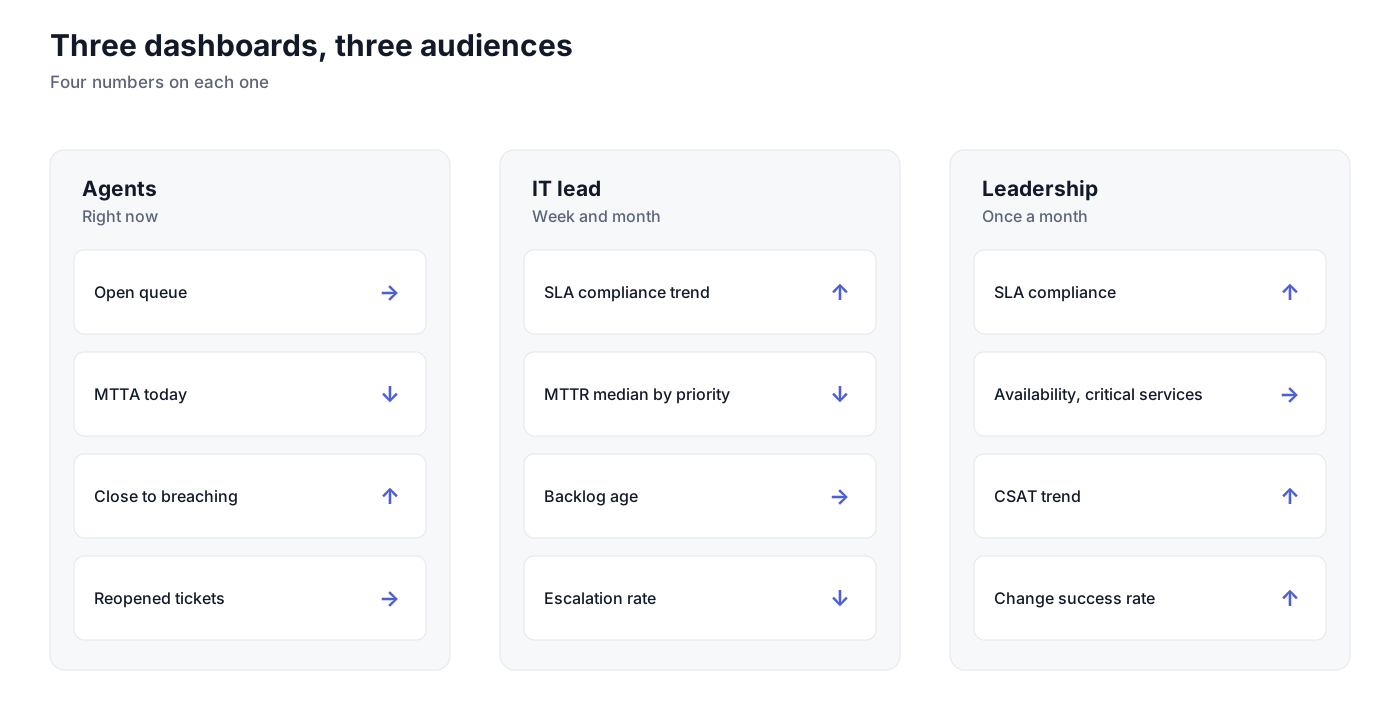
Agents are working on what is happening right now, such as:
- The open queue, with whatever is assigned to them
- MTTA for the day
- The tickets that are close to breaching their SLA
- Anything that has been reopened
The IT lead is looking at the week and the month instead. The SLA compliance trend goes on this one, along with the MTTR median broken down by priority, the age of the backlog, the escalation rate, and the categories that are producing the most tickets. These five are the numbers used when staffing and training are being planned.
Leadership is reading a report once a month, so the set changes again.
- SLA compliance for the period
- The availability of the services that have been marked critical
- The CSAT trend across the quarter
- A count of the major incidents
- Change success rate
The layout and the widgets of a help desk dashboard are a separate question. Which numbers go on it is decided by the person who will be reading it.
Track SLA performance where the work happens. Suptask measures response and resolution times on every Slack ticket. SLA breaches trigger alerts before they hit your report. See SLA and response-time reporting in Slack
ITSM Metric Traps to Avoid
Green on every SLA and unhappy users at the same time is called the watermelon effect, green on the outside and red inside. The target was met on paper, and the requester still did not get what they needed. SLA compliance has to be read along with CSAT, because neither of the two shows it on its own.
An average will hide a long tail. A month where most tickets closed quickly, and a few of them ran for weeks, is still going to give an acceptable mean resolution time. The median should be reported with it, and a percentile like the 90th will show you what the slowest tickets are doing.
A ticket that gets closed early and then raised again as a new one is counted as a resolution, and first contact resolution goes up with nothing having improved. The reopen rate and the volume of fresh tickets in the same category are what catch it.
Putting these numbers against individual agents will change what people do with the tickets. Picking up the easy ones first, and closing before the requester has confirmed, are both responses to being measured that way. The KPIs belong on the practice and on the team, and a per-agent view can be kept separately for coaching.
The last trap is the metric which nobody acts on. When a number has been on the report for a long time, and no decision has ever changed because of it, the only thing it is costing is the time taken to collect it. Take it off at the next review.
How to Set Up ITSM KPIs This Month
Five steps, and all of them can be done within a month.
- The first step is picking the five starter KPIs and taking everything else off the current report. Five is the whole list till the next review.
- Then comes the baseline. Thirty days of your own data with no target on it yet, because a target that is set before the baseline is only a guess.
- Targets are set after that, and they should be agreed with the people who will be measured on them. The published SLA response time benchmarks can be used for a comparison, though the target itself gets built on your own 30 days.
- The three dashboards get built next, with four or five numbers on each one, split the way the audiences are split.
- The review runs monthly, and any KPI that nobody acted on during that month comes off the report.
By the end of the month, each of the five KPIs has a definition, a baseline, a target, and a place on a dashboard.
Frequently Asked Questions
What are ITIL KPIs?
ITIL KPIs are the measures that are used to show if a practice is meeting its goals or not. There is no fixed list given in ITIL 4. The practice guides list the success factors first for every practice, and then the key metrics are mapped to those success factors. MTTR is one example in the incident practice. The change in success rate is another one in the change practice. The target value is not given anywhere, each organization has to decide that in its own context.
What is a critical success factor in ITIL?
A critical success factor is an outcome that a practice has to achieve. Restoring the service quickly is one of them. Then one KPI or more than one KPI is attached to it to show whether the outcome is being met or not, so for restoring service quickly the measure used is MTTR by priority. In ITIL 4, the term has been changed to practice success factor. The old term is still used by a lot of teams in their reports, and it is there in most of the vendor material also.
What is MTTR in ITSM?
MTTR in ITSM is mostly taken as mean time to resolve. It is used for measuring the time from the logging of an incident up to its resolution. For the calculation, you take the total of that time for all the resolved incidents, and then it is divided by the number of incidents that were resolved. Some teams are using the same letters for mean time to repair, and some are using it for mean time to restore. These are not the same measurements. You should decide on one meaning, write it down somewhere, and report the number by priority.
What is the first contact resolution?
First contact resolution is the share of tickets that are getting solved in the first interaction only. Nothing is handed over to anybody, and no follow-up is needed after that. It helps to understand what your first line is able to handle on its own. The reopen rate should be seen along with it. A ticket that is closed before the issue is actually finished will still be counted in first contact resolution till the requester opens it again.
What is SLA compliance?
SLA compliance is the percentage of the tickets that had an SLA on them and finished within the agreed time. The response target and the resolution target should be measured separately. A team can be meeting the response target and still miss the resolution target, so one number for both of them is not that useful. The breakdown by priority is also needed. Without it, the volume of the low-priority tickets will cover up what is happening on the urgent ones.