
Help desk reporting is an act of fetching, analyzing, and sharing ticket system data. The data is then used to monitor performance, surface trends, and drive decisions. Most of the modern service desk platforms collect data, but fail in reporting. The reason is their focus on wrong things. They tend to track raw activity instead of the business impact.
Proper service desk reporting can transform vanity metrics into strategic intelligence. Below is the dashboard builder framework that provides a starting point to ensure help desk reports actually drive action.
Build Your Perfect Metrics Dashboard
For an effective dashboard, categorize your KPIs into a 5-pillar framework. Below are the 15 essential metrics and their formulas that your reporting platform needs.
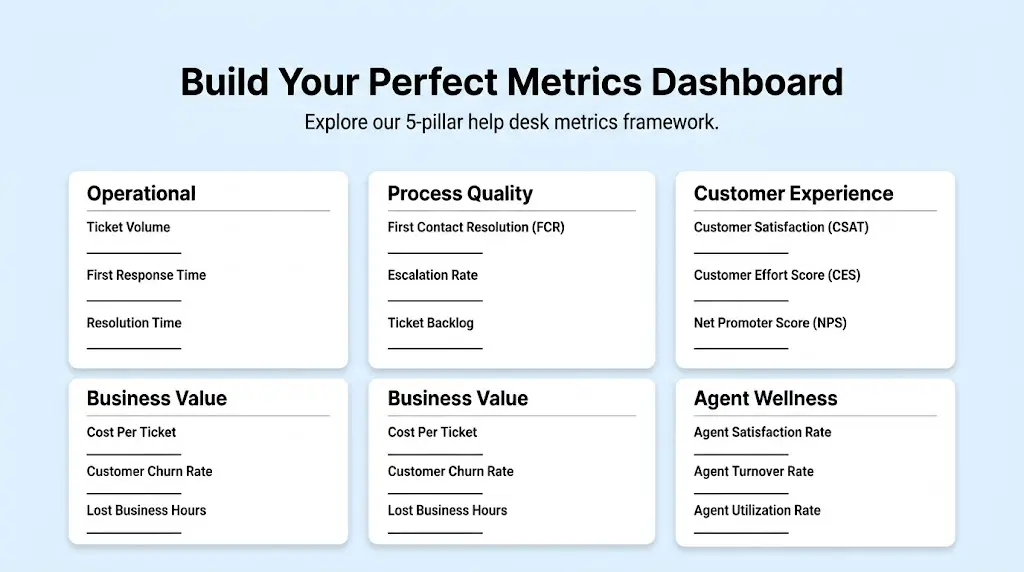
1. Operational
Ticket Volume:
Total support requests received over a specific period
First Response Time (FRT):
Time between ticket submission and the agent's initial response
Resolution Time:
Time between ticket resolution and closing customer issue
2. Process Quality
First Contact Resolution (FCR):
Ticket resolution percentage during first interaction
Escalation Rate:
Percentage of tickets forwarded to high-tier support
Ticket Backlog:
The number of unresolved tickets accumulating over time.
3. Customer Experience
Customer Satisfaction (CSAT):
Customer satisfaction rate with the support they receive
Customer Effort Score (CES):
Difficulty level to get an issue resolved
Net Promoter Score (NPS):
Loyalty and likelihood measure to recommend
4. Business Value
Cost Per Ticket:
Net financial cost per ticket resolution
Customer Churn Rate:
Customer loss percentage after support issues
Lost Business Hours:
Operational time loss due to support outages
5. Agent Wellness
Agent Satisfaction Rate:
Percentage of agents satisfied with their role
Agent Turnover Rate:
Percentage of support staff leaving over time
Agent Utilization Rate:
Percentage of working time spent handling tickets
Calculate Your Help Desk ROI
Understanding your return on investment is crucial. It can transform your support department from a cost center into a value driver. An effective ROI calculation involves:
- Time Saved: Measuring time saved during operations via automation. The optimized workflows and self-service deflection lower the Cost Per Ticket.
- Revenue Protected: Tracking churn mitigation and upgrades via support interactions. It improved overall retention.
By considering these two aspects, helpdesk reporting shifts from tracking expenses to ensuring real business value.
Modern Help Desk Dashboard sample
For today’s data demands, a static spreadsheet is not enough. Therefore, a modern help desk dashboard should be divided into core operational values. You can check the CX dashboard examples. The standard implementations are:
Real-Time Tab:
A live feed of active queues, agents online, and unassigned tickets. It stops SLA breaches before they happen.
Trends Tab:
Historical data looking at volume spikes and seasonal patterns. It helps track week-over-week performance changes.
AI Insights Tab:
Automated anomaly detection like alerting if password reset requests spike by 400% per hour. It assists in predictive staffing recommendations.
Master the 10 Best Practices
The difference between helpdesk reports and strategic intelligence comes down to process. If you aim at elevating your reporting, master these ten help desk best practices:
1. Engage Stakeholders as Strategic Partners
Don’t just send raw data. Work with product as well as engineering teams to understand the key insights. In order to uncover the best customer service KPIs, cross-functional alignment is necessary.
2. Focus on Business Drivers, Not Details
Your executive team does not care about individual ticket tags. What they actually care about includes churn rate, retention rate, and the cost. So, map your support metrics directly to the company goals.
3. Established a Tiered Reporting Cadence
Not every metric needs daily review. So, you should implement a daily standup for operational queue management and a weekly review for process quality. Additionally, you should go for a help desk monthly report for executives for business value and ROI.
4. Customer Effort Score as North Star
CSAT is reactive while CES is predictive in nature. The most reliable way to improve loyalty is to focus your reporting on reducing customer friction. You can consult our guide on customer engagement metrics for rollout strategies.
5. Contextualization Data with Qualitative Insights
Numbers speak about what is happening while customer quotes answer why. That’s why, always pair quantitative dashboards with survey comments or support interactions.
6. Automate Data Delivery
If you have to spend hours exporting CSVs and making pivot tables, it indicates the broken process. Schedule automated reports and push to email or Slack directly from the ticketing system.
7. Segment by Customer Tier and Issue Type
Technically, an enterprise customer SLA breach is the same as a free-tier user breach. However, the business impact is very different. So, always choose to segment your reporting by revenue impact.
8. Monitor Agent Wellness Indicators
Agent burnout directly relates to declining customer satisfaction. You should track backlog growth and utilization rates to predict and prevent turnover before it becomes a reality.
9. Align CSAT and CES Effectively
Never ever view these metrics in a vacuum. High CSAT and poor CES are an indication of friendly agents with products difficult to use. Aligning these customer service metrics sketches an overview of the customer journey.
10. Radical Transparency
Ensure your dashboards are public to the entire company. It ensures that the product team can see feature requests and real-time bug reports. This way, the support ceases to be a silo and becomes the customer's voice.
Read our industry help desk metrics guide to find out the targets to aim for and know exactly what these matrices mean.
Assess your AI Reporting Maturity
Are you integrating AI effectively in your reporting system? Use this 3-question maturity test your organization:
- Are your metric insights descriptive or predictive?
- How is qualitative feedback analyzed?
- Do your reports suggest actions?
Vanity vs. Actionable Metrics
Whether your organization calls it a helpdesk or help desk, reporting on vanity metrics gives you a false sense of security. Actionable help desk reporting metrics highlight areas for improvement.
Real-World ROI Success Stories
Valuable data proves the value of optimized reporting. Below are some of the case studies demonstrating that:
Eurail:
Eurail restructured their reporting to focus on automated ticket routing and First Response Time. It reduced average resolution times. The premium customer satisfaction was maintained even during peak seasons. It resulted in 82% CSAT.
EchoStar:
EchoStar shifted from manual to automated tracking for sales audits and summarization. The company saved more than 35k work hours annually this way. The operational costs for sales call audits were reduced by 90%. The overall workforce productivity of up to 25% was seen.
UK Utilities Provider:
UK Utilities Provider (Centrica) shifted from default to managed personal productivity environments for better application management. It used Copiolet Studio to automate unified multi-agent help desk orchestration and maker environment routing. It resulted in over $10 million in operational savings.
Grove Collaborative:
Grove Collaborative focused on their operations to focus on intelligent triage and automated messaging. As a result, unpredictable chat volumes were reduced. It maintained premium customer satisfaction despite staff reductions. It resulted in 95% CSAT.
Closing CTA
Your help desk reporting should not be manual. Instead, it should be a strategic asset. Stop wasting hours fetching abundant data and proving the ROI of your customer support team. Are you ready to upgrade your analytics maturity? Follow data analytics solutions of Suptask to build the efficient dashboards.
Frequently Asked Questions
Which KPIs should I start with if my team is new to reporting?
You should begin with one from each pillar like First Response Time (Operational), First Contact Resolution (Quality), Customer Effort Score (Experience), Cost per Ticket (Financial), and Agent Satisfaction (Wellness).
How do you calculate the true Cost per Ticket?
Take total support center costs for a time period and divide it by the total number of tickers resolved in that time period to calculate Cost per Ticket.
Should I prioritize CES or CSAT?
For measuring agent performance and interaction satisfaction, CSAT is a great option. On the other hand, for predicting customer churn and loyalty, CES is better. Simply put, track both but use CES for making product decisions.
What is a good benchmark for First Contact Resolution (FCR)?
In industry, FCR rate ranges between 70% and 75%. If it is below 60%, it is an indication of lack of knowledge, and agent enablement. It may also mean a complex product.
How do I link help desk metrics to company revenue?
You can do it by focusing on account expansion and churn prevention. Track customer retention rate of who submits tickets versus who don’t. Later, measure the protected revenue by high-CSAT support.
Does automation negatively impact customer satisfaction?
It might do but only when implemented poorly. Automation for simple tasks like order tracking and password resets, improves CSAT. It does so by reducing wait times. Besides, complex tasks require human intervention.
What is the ideal reporting cadence?
You should monitor operational metrics like FRT, volume, and SLAs real-time or daily. The process metrics like Reopen rate and FCR should be reviewed weekly. Lastly, the strategic ones like CES, ROI, and Cost per Ticket should be packaged into a help desk monthly report.
How do we roll out CES reporting survey fatigue?
It is poor practice to send a CES survey after minor interactions. Go for them after onboarding completion and high-friction events. Always keep the survey to a single question with a simple scale (1-5 scale).