AIOps is the use of artificial intelligence for IT operations, which means machine learning is applied to your monitoring data to identify problems and work out what caused them.
Modern IT does not run on one tool. There is monitoring on the servers, on the network, on the applications, on the cloud spend, and all of it reports into the same few channels. Those tools generate alerts on their own schedule, and reviewing them is separate work that a person has to do.
This guide goes through how AIOps works, the use cases, the benefits, the challenges, where it stands against DevOps, MLOps, observability, and whether your team is at the size that needs it.
Key Takeaways
- AIOps is the use of machine learning on IT operations data. It helps to find the problems earlier, and the alerts that belong to one cause get grouped together into a single incident.
- The data comes first, metrics, logs, events, change records. Correlation runs on that data, then anomaly detection, then a likely cause is put forward for an engineer to confirm.
- Noise reduction on the alerts, root cause analysis, early warning on capacity, these are the use cases this guide covers.
- DevOps is about how the software gets shipped, MLOps is about keeping machine learning models running in production. AIOps works on the operations data of a system that is already live.
- Alert ownership and a written incident process should be fixed before an AIOps platform gets bought. AIOps groups the alerts, somebody still has to own the incident and close it.
What Is AIOps?
AIOps is the use of machine learning and big data on IT operations data. The model reads what the tools produce, groups the alerts coming from one cause, and helps the operations team with a likely explanation.
The term came from Gartner in 2016. The AIOps definition in Gartner’s glossary is built on two things applied to IT operations work, big data and machine learning, with event correlation, anomaly detection, and the determination of cause named as the processes it automates. The acronym stood for algorithmic IT operations at first, and artificial intelligence for IT operations is what it settled into a year or so later.
The meaning of AIOps remains the same across the different vendors, though each one describes it in terms of what it sells. Monitoring collects the data and raises alerts against thresholds. The question of why a system is behaving in a certain way comes under observability. AIOps works on top of both, because the analysis needs that data to exist first. All three are part of IT operations management, the wider practice of keeping services available and performing.
How AIOps Works
AIOps works on the data that monitoring tools have been collecting already. The platform reads the data and puts the related alerts into one group. Anomalies in data get flagged, so your operations team receives, in the end, one incident with a suggested cause on it.
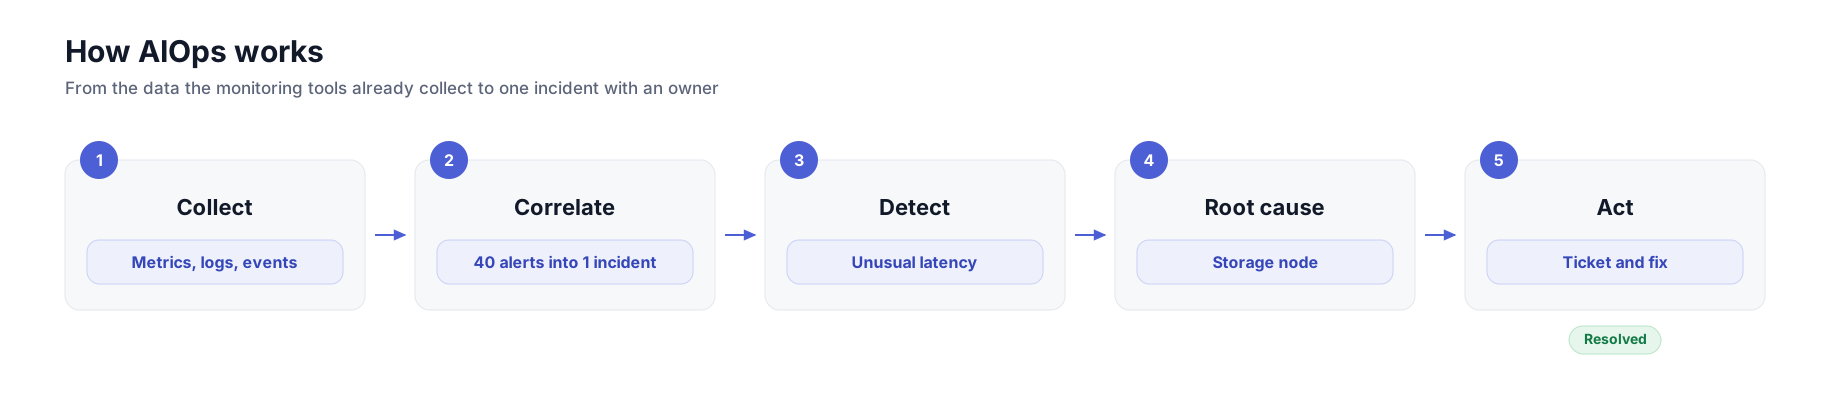
The lifecycle of AIOps can be described as observing, engaging, and acting. Observing covers the data and analysis, engagement is the output sent to people, and act refers to the automation.
Data Collection
The platform takes the tools you already use. This feed includes metrics, traces, events, change records, and ticket history. The format of the data may vary between tools, so timestamps and host names get mapped onto one format before anything else is analyzed.
Event Correlation
Event correlation refers to grouping all the related alerts into one incident. AIOps event correlation happens after the alerts get logged.
Three signals work on event correlation. Alerts that fire in the same short window. Services that depend on each other, so a database alert and the application reading from it get grouped. Also, alerts that repeat get logged once rather than as a separate entry for each repetition.
Anomaly Detection
The model works on the normal range for each signal. So, anything that falls outside the range gets flagged. The numbers are not predefined, AIOps can learn from the data and find the difference between normal and abnormal.
Root Cause Analysis
Symptoms for each alert get mapped onto the dependency graph. The platform works on the components that explain the rest. AIOps analyzes the recent changes to help the operations team with possible causes, not confirmed ones.
Prediction and Automated Response
Trends help to identify the issues earlier. For example, a disk fills at a steady rate, so an alert can come a week ahead.
The response can be automated. A runbook restarts the failed service or drains the queue. Most teams work on this in a pilot phase. The platform recommends, a person approves.
AIOps Components and Architecture
AIOps architecture can be described in three layers. Each layer has a dependency on the one below it, so the automation at the top is only as good as the data collected at the bottom.
Platforms are sold in two forms. Domain-agnostic platforms work on data from any source, and domain-centric platforms work inside one area such as the network or application performance.
AIOps Use Cases
AIOps use cases can be grouped under seven headings. One AIOps example is given for each of them.
- Alert noise reduction: Repeated and duplicated alerts get counted once instead of being sent again and again. A single host failure can be reported by multiple tools depending on it for the same fault. The operations team receives one alert with a possible cause to fix.
- Root cause analysis: Symptom alerts are mapped onto the dependency graph, so the component underneath them gets identified. The candidate cause attached to each ticket is the starting point for AI incident management, where analysis is performed after the incident has been logged.
- Early warning: A disk filling at a steady rate has a date on which it will run out. A memory leak shows a slow rise in usage between restarts. Both can be raised before the service goes down.
- Change-related incidents: Changes released in the same window as an alert get flagged against it. The release that went out an hour before the alert is the first thing an engineer should be shown.
- Capacity planning: Usage trends are read against the headroom that is left, so the platform can predict when more capacity will be needed.
- Cloud cost anomalies: A sudden rise in the spend on one service gets flagged in the same way a sudden rise in latency does.
- Automated remediation: A runbook attached to a known condition restarts the failed service without anybody being paged for it. Agentic AIOps is the next step on from this, where agents gather the logs, run the checks, and then wait for approval before anything is changed in production.
Benefits of AIOps
AIOps benefits follow from the work described above, and they show up in five places.
- The number of alerts reaching a person is smaller, because the duplicates and the related ones have been grouped before the notification goes out.
- The dependency graph helps to shorten the search for a cause, and an engineer starts from a candidate component instead of the alert list.
- Slow problems get caught at the trend stage. A disk that will fill next week is a plain example.
- Manual analysis stays for the hard incidents. The repeat work of pulling the logs and checking the dashboards happens before an engineer picks the ticket up.
- Capacity and change decisions are made on the history the platform has already collected, so the planning works on recorded usage.
Challenges of AIOps
A few challenges come up with AIOps in practice, and you should know about them before anything gets bought, such as:
- The data should be connected properly from all the tools you are running, because a platform that is getting the data from only some of them will give you partial answers, and the correlation then misses whatever those missing tools would have reported.
- You should keep the automation in suggestion mode at the start, so the platform is only recommending the action and a person is approving it. The automatic runbooks can be added later, for the conditions which are already well understood.
- Anomaly detection needs some history before it becomes reliable, as the baseline has to be learned from the past data, so you should not expect much out of it on the first day.
- Somebody from the team should be made the owner of the tuning, the grouping rules, the runbooks, and the thresholds that remain, otherwise, the output drifts over time, and people go back to reading the raw alerts.
- Price is the last one, and it should be weighed against the alert volume you are actually handling.
AIOps vs DevOps vs MLOps vs Observability
Three comparisons come up with this term, AIOps vs DevOps, AIOps vs MLOps, and AIOps vs observability. All four are set out in the table.
The four are not alternatives to each other. Observability produces the data that AIOps works on, so one is feeding the other, and the same division runs through ITSM vs ITOM, where the service side carries the tickets and the operations side carries the infrastructure.
Do You Need AIOps?
You need AIOps when the alert volume has grown past the people reading the alerts. If a few people can still handle every alert that comes in, then the answer for now is no.
Four questions help to settle it:
- More than a few hundred alerts in a day?
- Five or more monitoring tools in use?
- Incidents where the cause takes hours to find, coming back again and again?
- On-call engineers worn down by the night pages?
The more of these that get a yes, the stronger the case for a platform. Some of these can be fixed without buying anything, and it should be done first because an AIOps platform inherits whatever mess it is given. The alerts should be tuned and deduplicated, so the ones that never need action stop firing. Every alert should have an owner on it, a team name at least. The alerts should arrive in one place instead of being spread across inboxes and channels. A written incident process helps here too, who declares an incident, who communicates, who closes it at the end.
Teams whose alerts and the fixes behind them go to engineering can handle the ownership part with DevOps ticketing, where an alert posted in a channel becomes a ticket that somebody owns.
From AIOps to the Service Desk
AIOps groups the alerts and explains them. Somebody still has to own the incident, keep people updated, and close it at the end. AIOps incident management covers the analysis part, the rest of the work runs through the service desk.
The AIOps ITSM handoff works in five steps. The platform raises one correlated incident. A ticket is created from it, with an owner and a priority. Updates go onto the ticket while the work is going on. The resolution gets recorded once the service is back. A post-incident review follows for the major ones, and the problem record comes out of that.
The steps on the ticket are the same as in any incident management process, so the logging and the prioritizing do not change because the alert came out of a model.
When the alerts are already being posted into Slack, a Slack help desk can pick them up from the channel they land in. In Suptask this turns alerts into incident tickets in Slack, each one with an owner and a priority on it. The engineering fix can be linked to a Jira issue, with the comments and the status synced between the two.
AIOps Example: One Storage Failure, 40 Alerts, One Ticket
A single failing component can produce alerts across everything that depends on it. The sequence below shows what that looks like with AIOps in place.
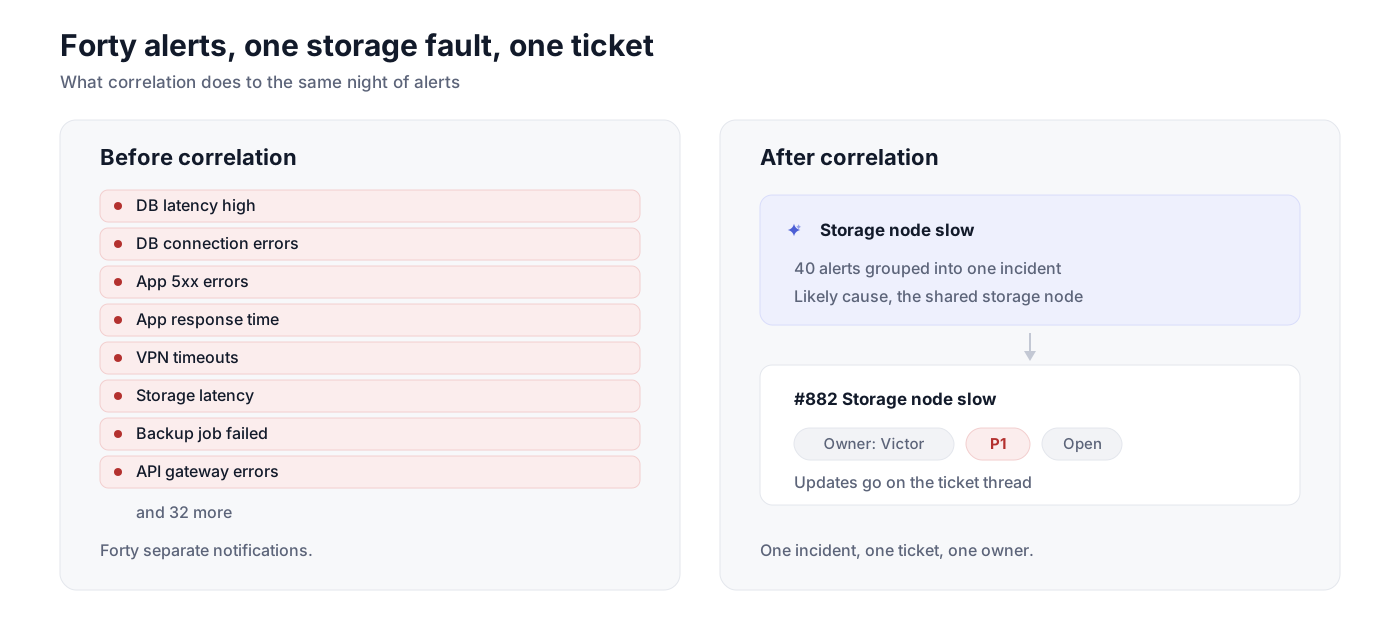
- 02:14 A storage node slows down. Forty alerts fire across the databases, the applications, and the VPN.
- 02:15 The platform groups them into one incident, and the storage node is flagged as the likely cause.
- 02:16 The incident posts into the ops channel in Slack. It becomes a ticket owned by the on-call engineer, Victor.
- 02:40 Victor fails the storage node over. The services recover.
- Next day, a post-incident review is held, and a problem record is raised to replace the hardware.
An outage on this scale follows the major incident management path, where the incident gets declared, and somebody is assigned to communications.
Without the correlation step, those forty alerts arrive as forty notifications, and the same storage node has to be found by reading them. Every correlated incident still needs an owner. In Suptask, alerts posted in Slack become tickets automatically, with an owner, a priority, and a thread for updates.
See how alerts become tickets in Slack
How to Get Started With AIOps
An AIOps implementation should begin before any platform gets picked.
- Start by counting what you already have, monitoring tools in use, alert volume in a normal week, and how many of those alerts actually lead to somebody doing something about them.
- The alerts should be cleaned up after that, with an owner put on each one. Anything that never needs an action can be switched off at the source.
- You can pick one use case for the pilot. Noise reduction or root cause, one of the two is enough to begin with, and change records and the ticket history can be added later on.
- You should measure the before and the after, otherwise, there is no way of telling whether the pilot worked at all. MTTD, which is the mean time to detect, MTTR, which is the mean time to resolve, and the alerts per incident. These are standard ITSM KPIs, so the baseline figures may already be there in your reporting.
- Expand to a second use case once the first one has held up for a while. The best AIOps tools are built around different strengths, which is one reason the shortlist is easier to draw up after a pilot than before it.
Count Your Alerts This Week
An hour of work this week should give you your own answer. Pull the alert count for last week, whatever your monitoring tools have recorded. Go through it and mark the alerts that actually needed somebody to do something about them. Then write down which tools sent the rest, because that is where your noise is coming from.
A small count with a lot of noise in it means the cleanup should come first. AIOps is the next step when the volume is high, and the causes are taking hours to find.
Frequently Asked Questions
Who coined the term AIOps?
Gartner coined it in 2016. The term described a category of platforms at that time, the ones that combine big data with machine learning to take over IT operations tasks like event correlation and anomaly detection. The acronym stood for algorithmic IT operations in the beginning, and artificial intelligence for IT operations is what it became within a year or so.
What is agentic AIOps?
Agentic AIOps is the version where AI agents do the investigation themselves. The agent gathers the logs, runs the checks an engineer would run, and comes back with what it found. Some of them can take action as well, restarting a service, for example. A person should stay in control of anything that changes a production system, so the approval step is kept in the flow.
What is the difference between AIOps and ITSM?
They work on different things. AIOps is used on the operations data, so the problems get detected and explained before anybody has read through the alerts. ITSM covers the way IT delivers its services to people, the incidents, the requests, the changes. The two meet at the ticket, where an incident that came out of AIOps gets an owner and then goes through the normal process.
Will AIOps replace IT operations teams?
No. The sorting of alerts and the suggesting of causes is what gets taken over. Decisions on the fix stay with people, so do the change approvals and the conversations with the business. What changes is where the time goes, with more of it spent on tuning the platform and on the incidents that are complicated.